The client dashboard every Better Off Growth client gets
See what your website is doing, any day you want to look.
Every client gets a login to their own dashboard: where the site ranks on Google, which searches bring people in, and every lead with the page and search that sent it. It comes with both plans at no extra cost. The screenshots below are from a sample account for a fictional HVAC company.
Where you rank, every week
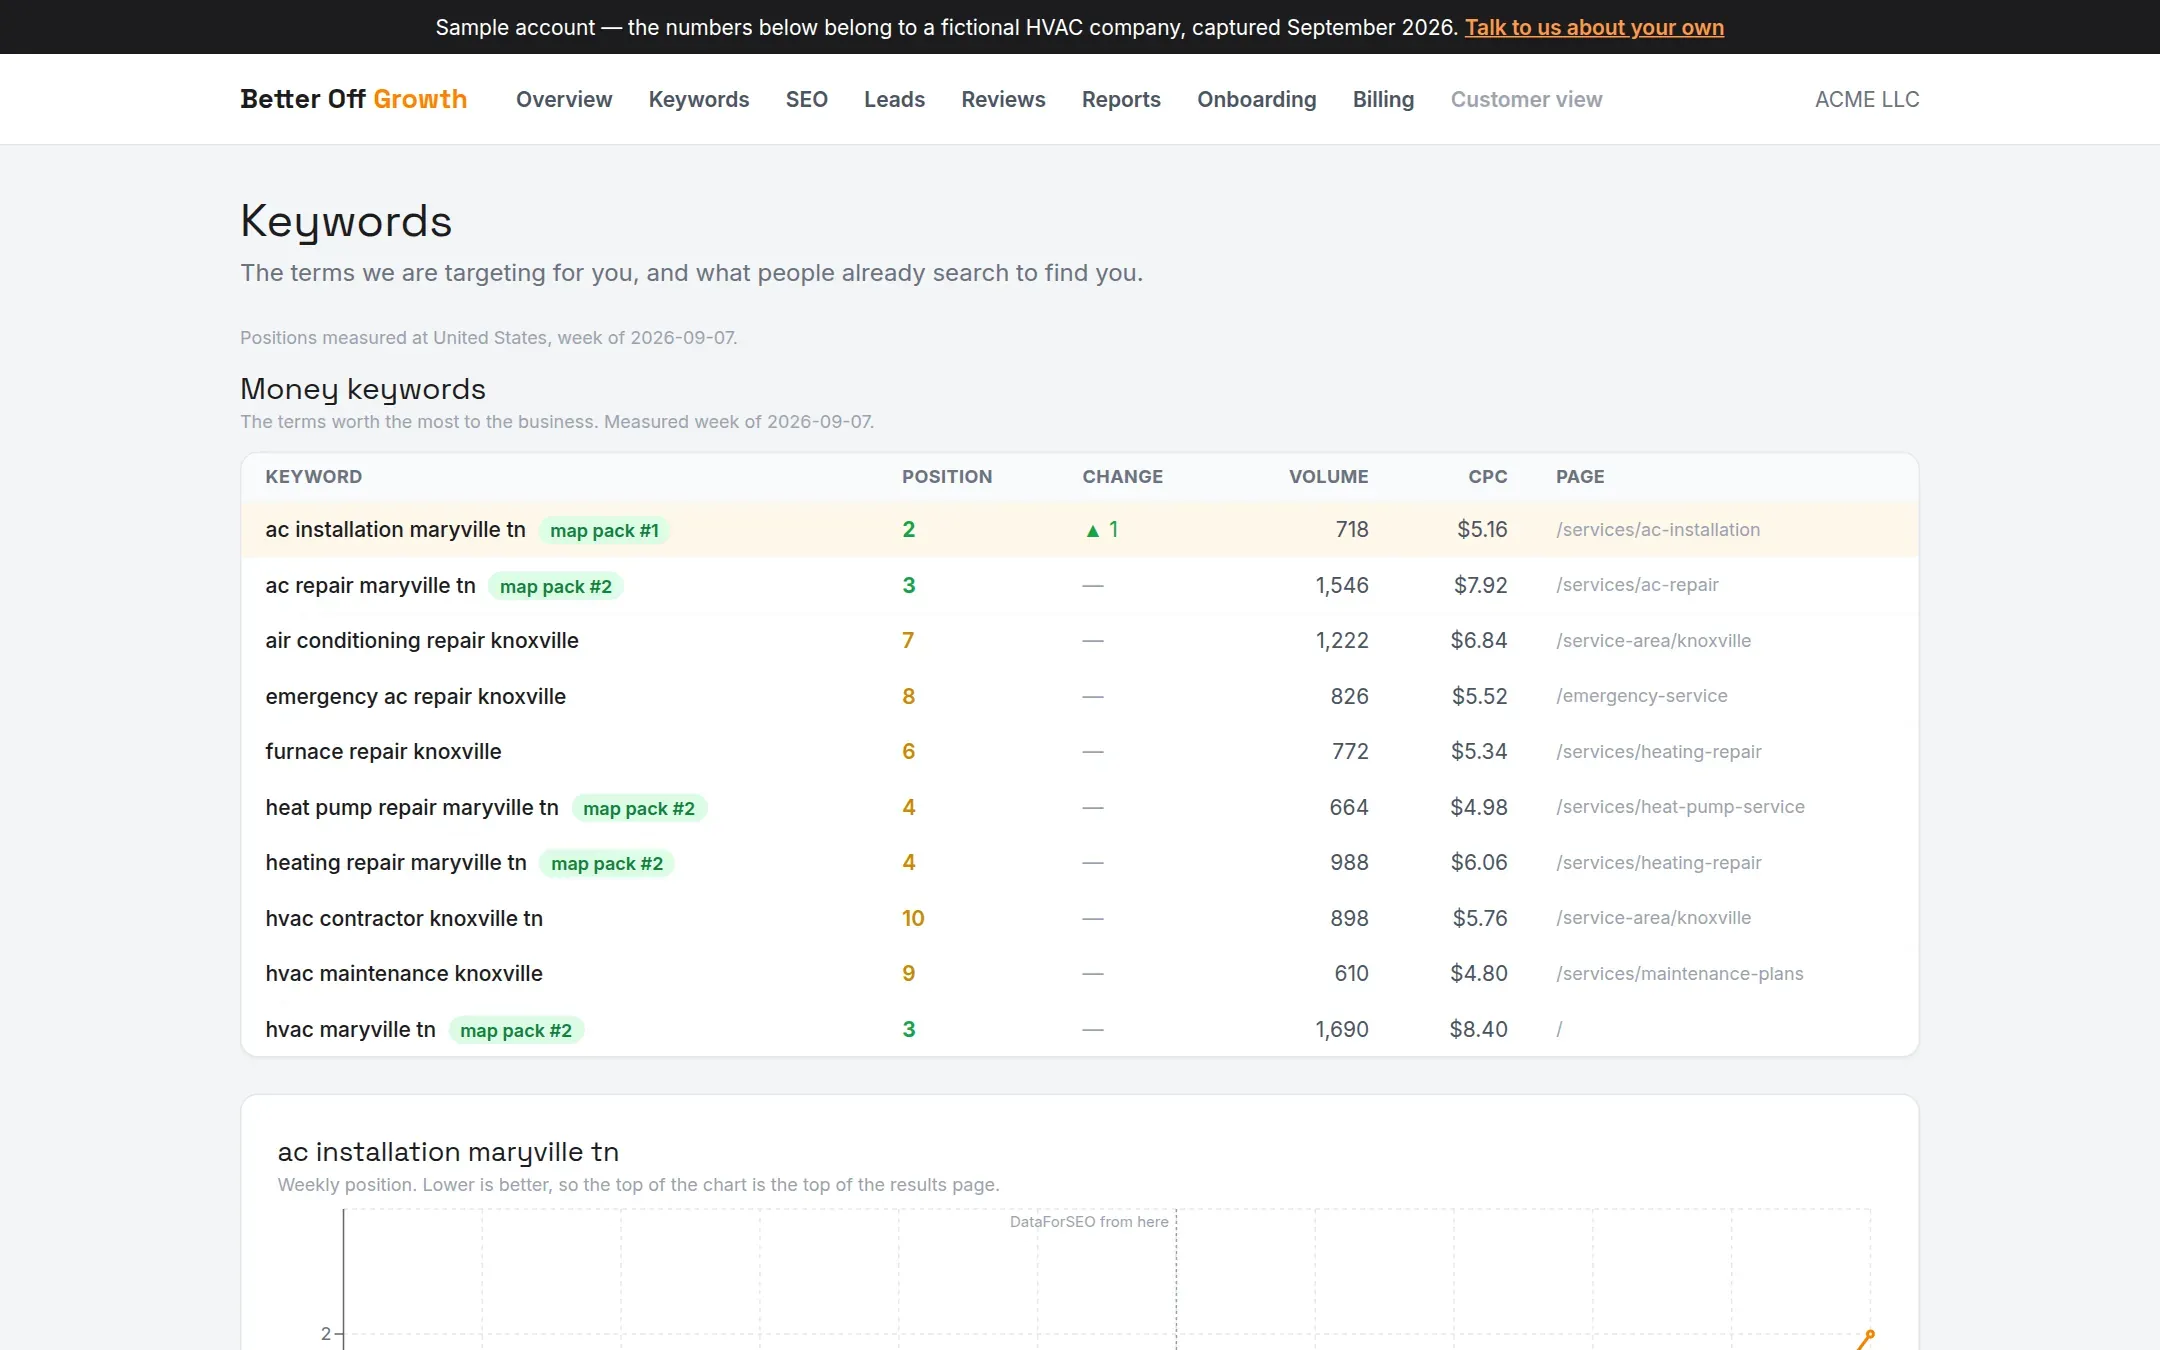
Each week the dashboard checks where your site sits on Google for the searches that matter to your business, in the towns you serve. The ones worth the most to you sit at the top.
Each line shows your position and how it moved, whether you are in the map pack, how many people search that term a month, and which page on your site is ranking for it.
Your map pack, from every corner of town
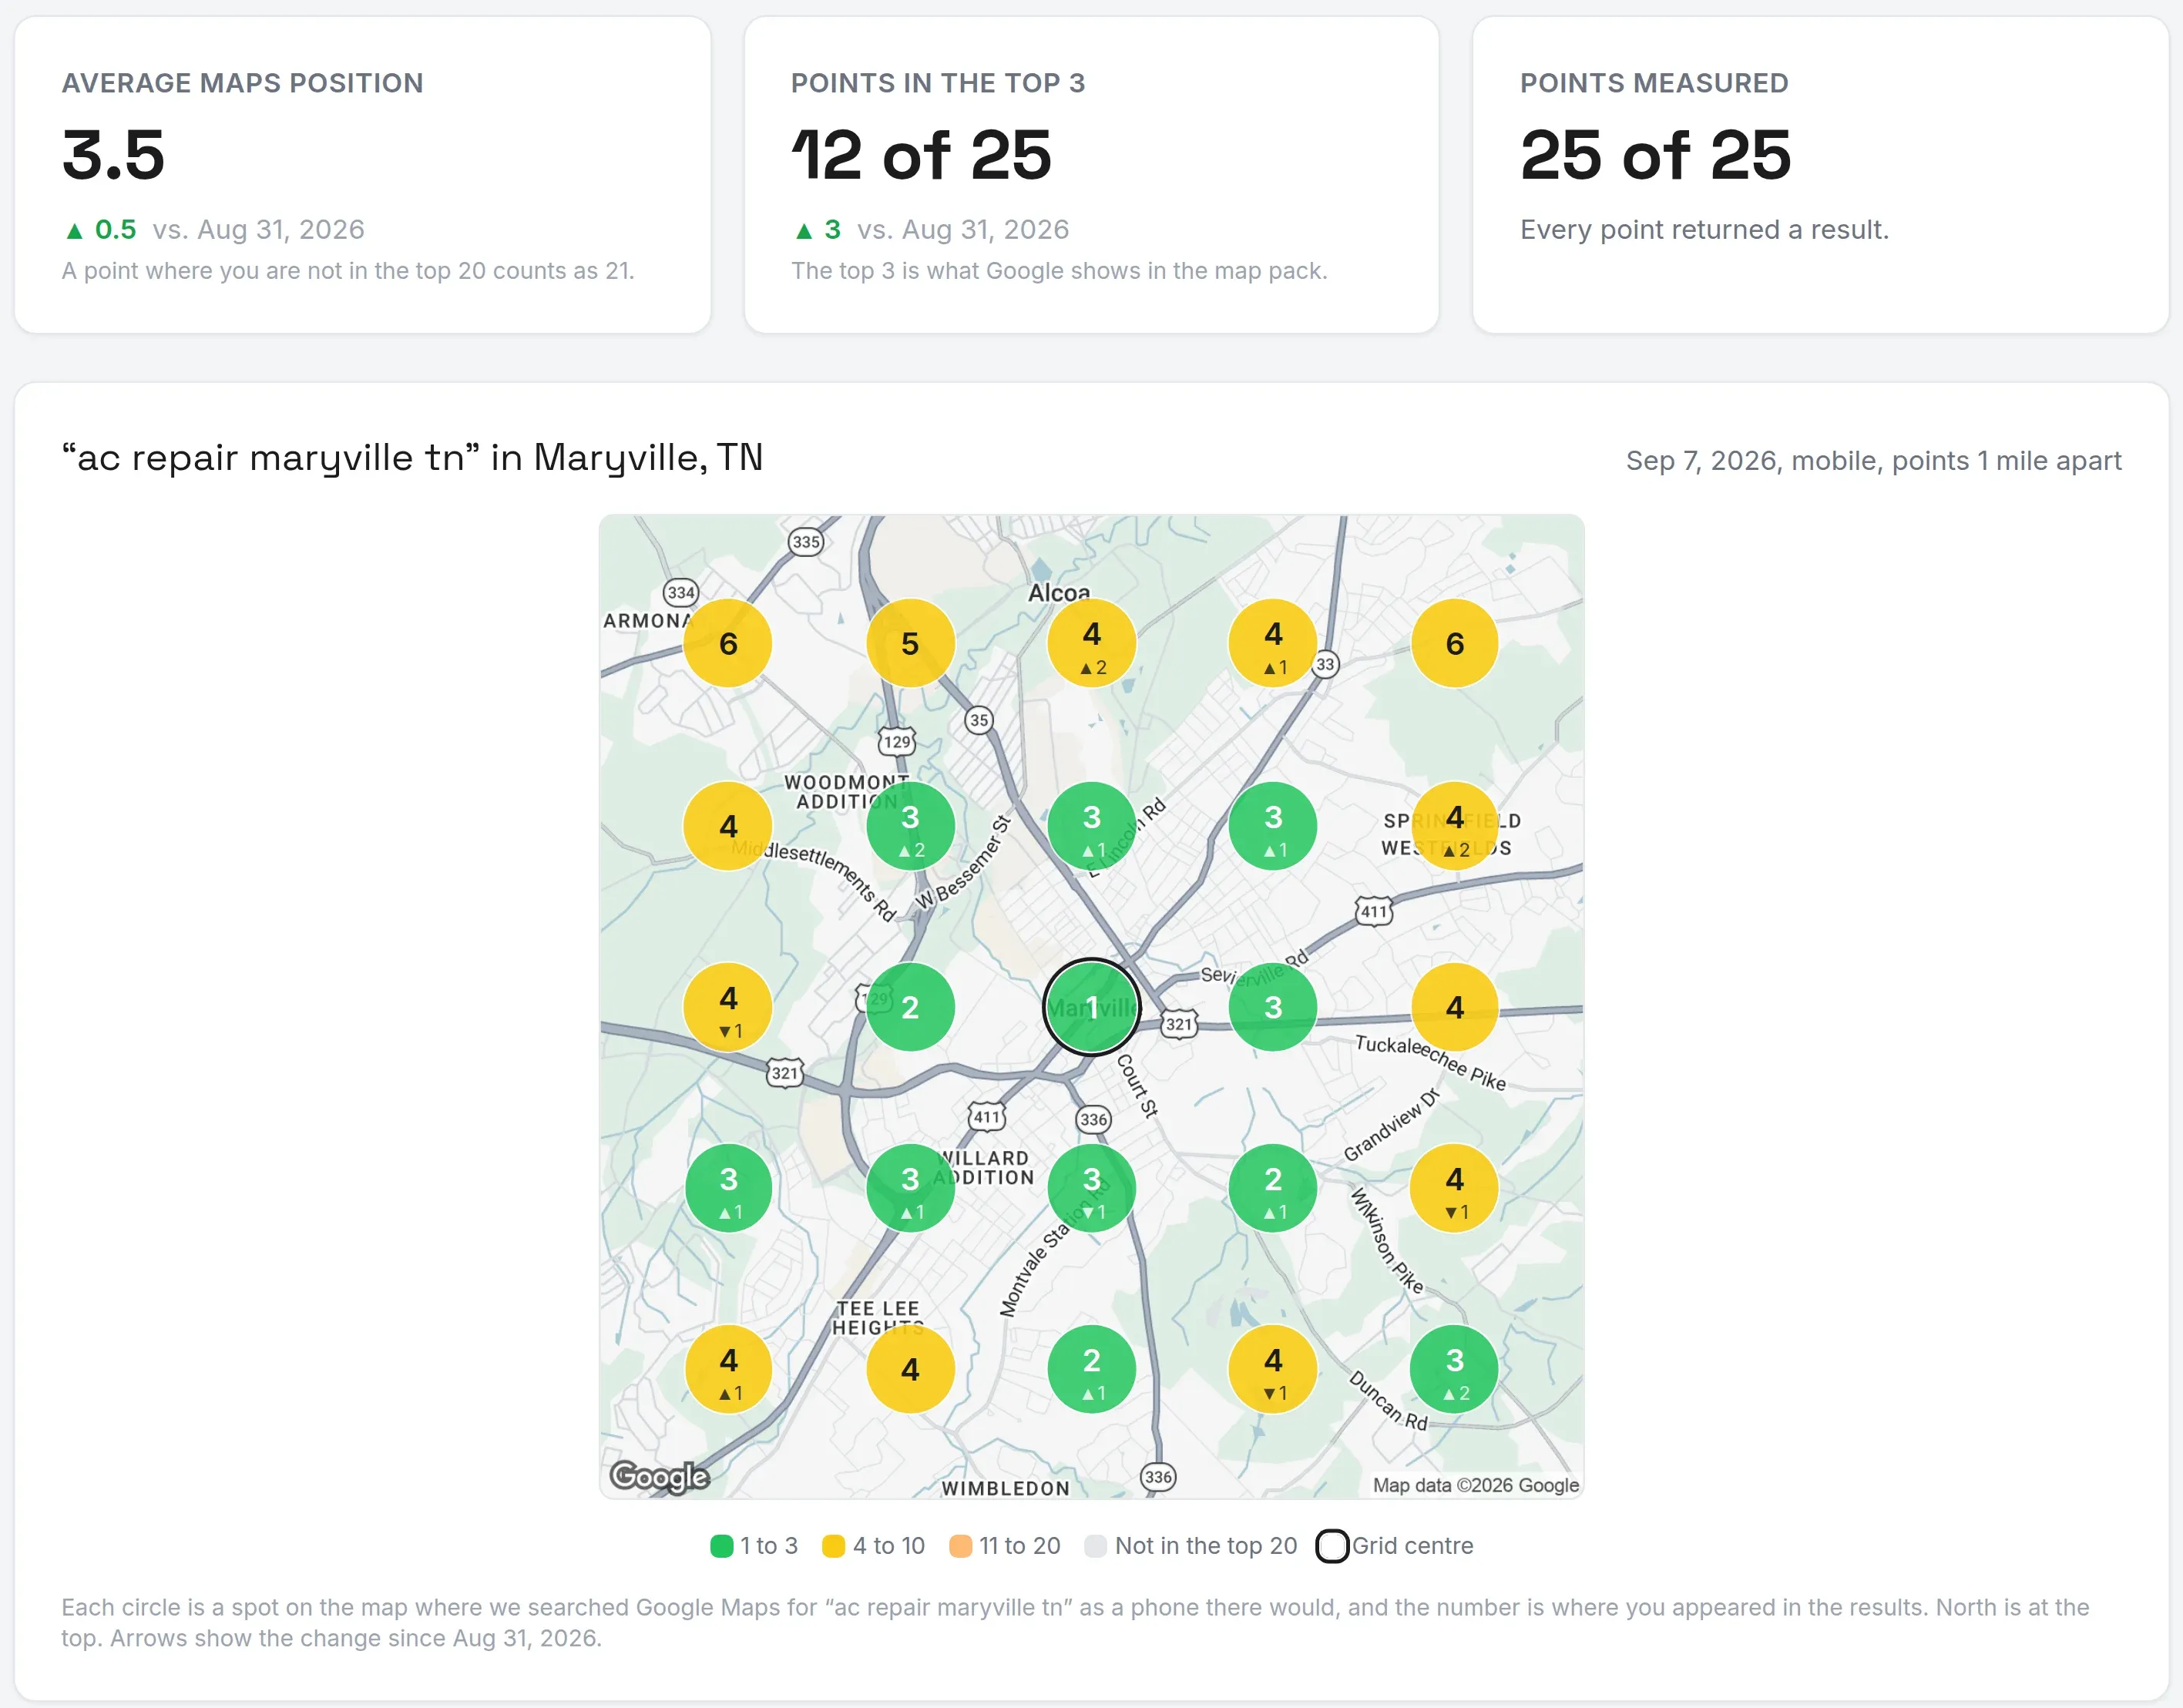
Where you show up on Google Maps depends on where the person searching is standing. So every week the dashboard searches your most important keywords from 25 spots around your business, a mile apart, the way a phone at each spot would.
Green means you are in the top 3, which is what Google shows in the map pack. The arrows show what moved since the week before.
Every lead, with where it came from
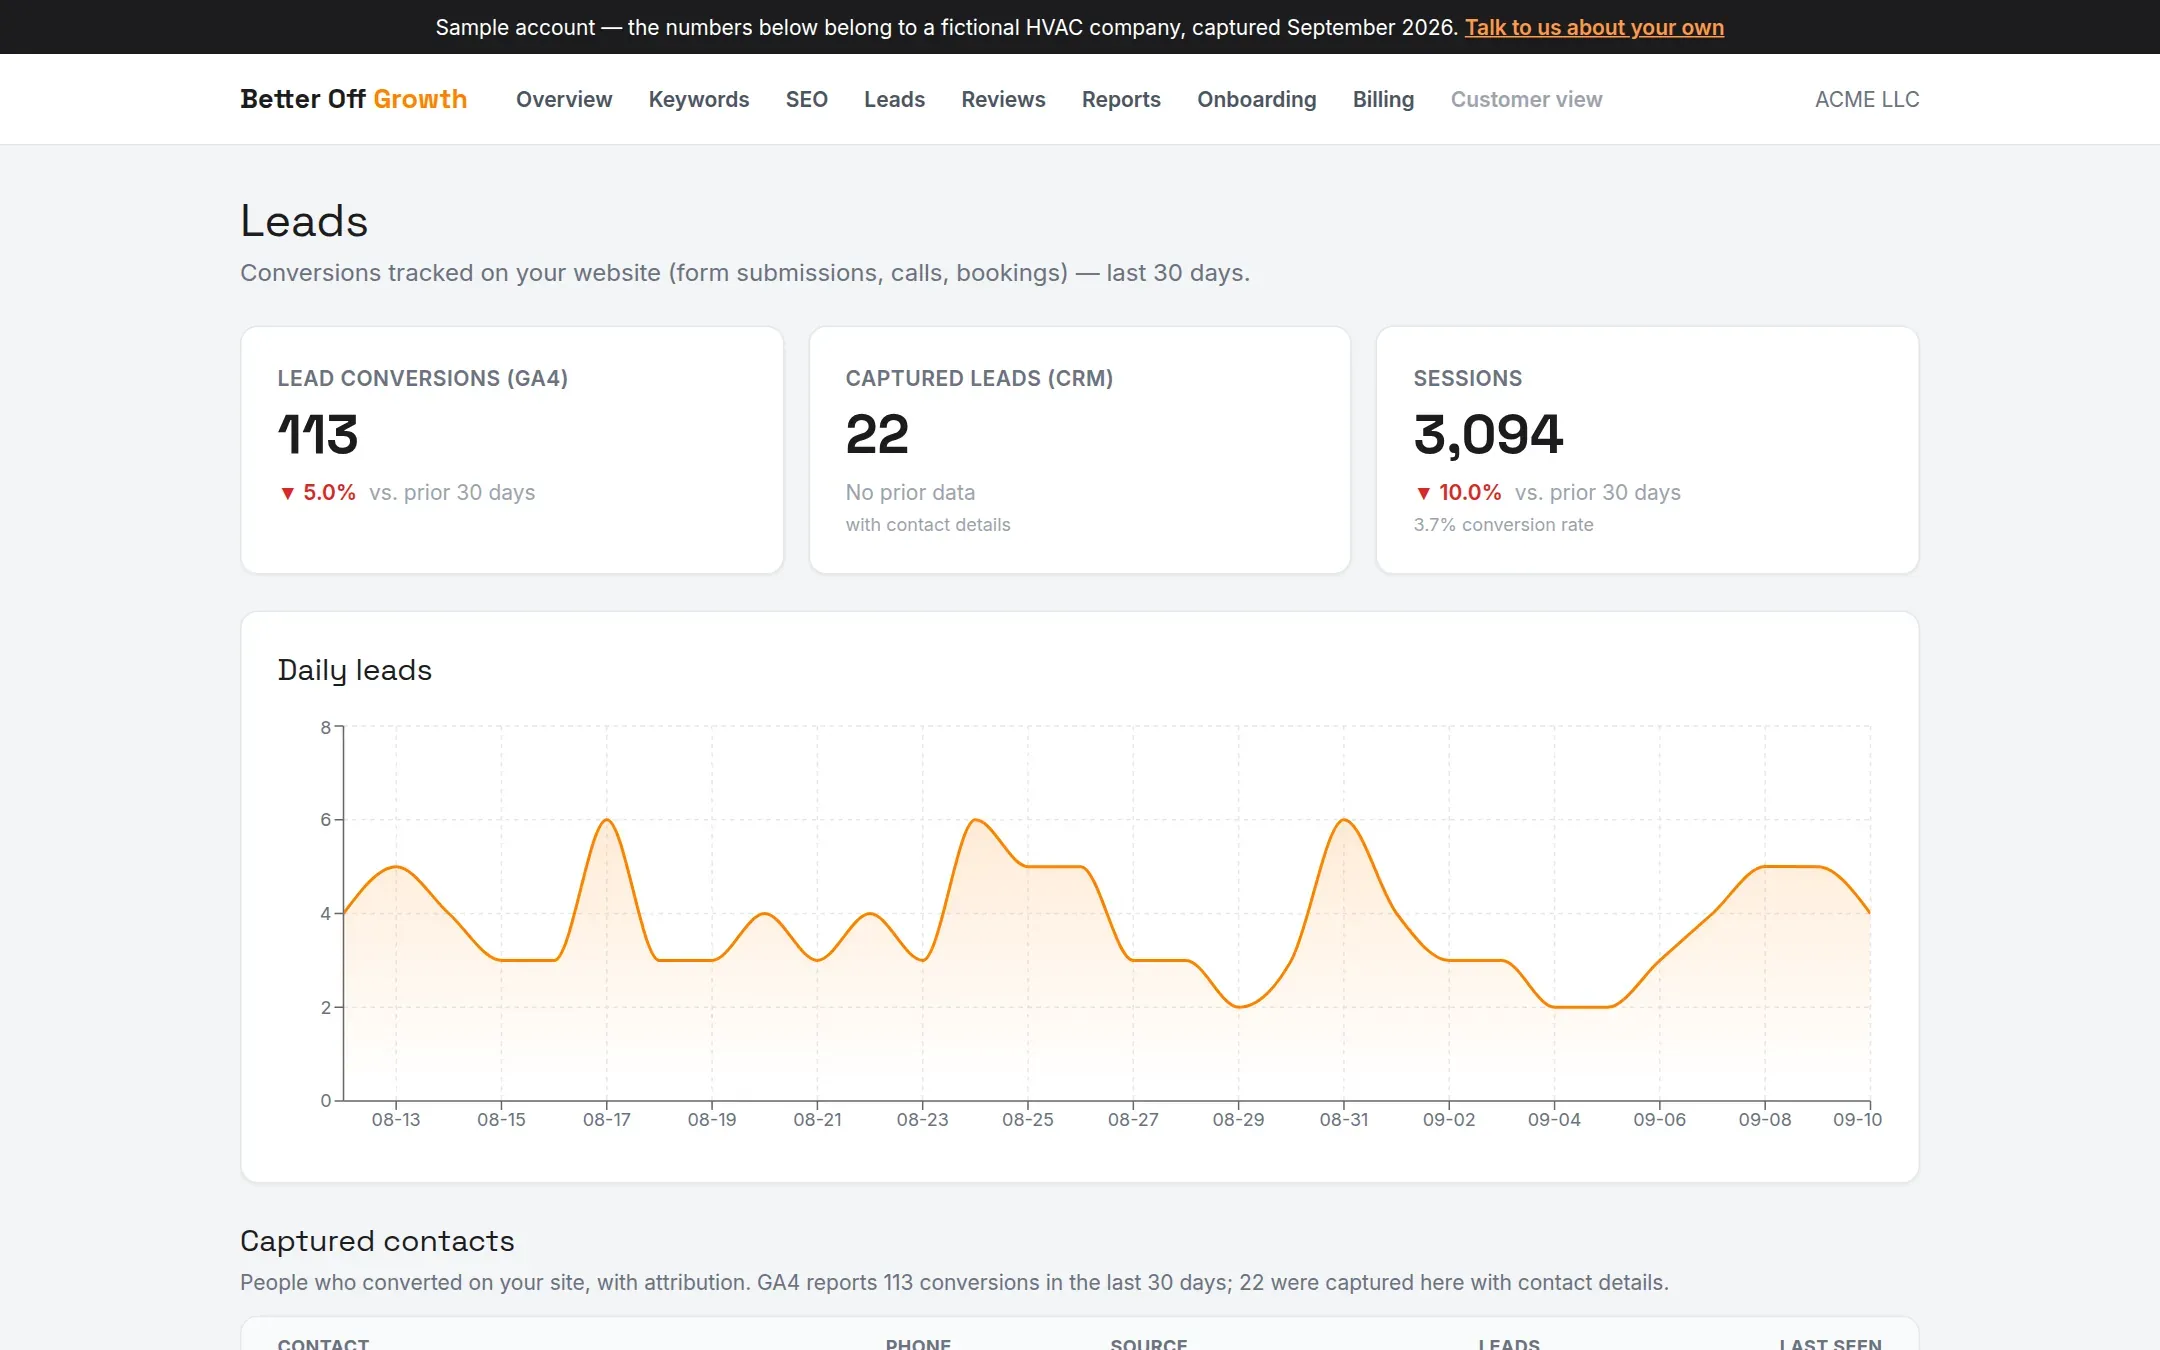
Form submissions and calls from your site land here with the page they started on and the search or site that sent them.
That is how you can tell which pages bring in work and which only bring in visitors, and it is where the numbers in my reports to you come from.
The whole picture on one screen
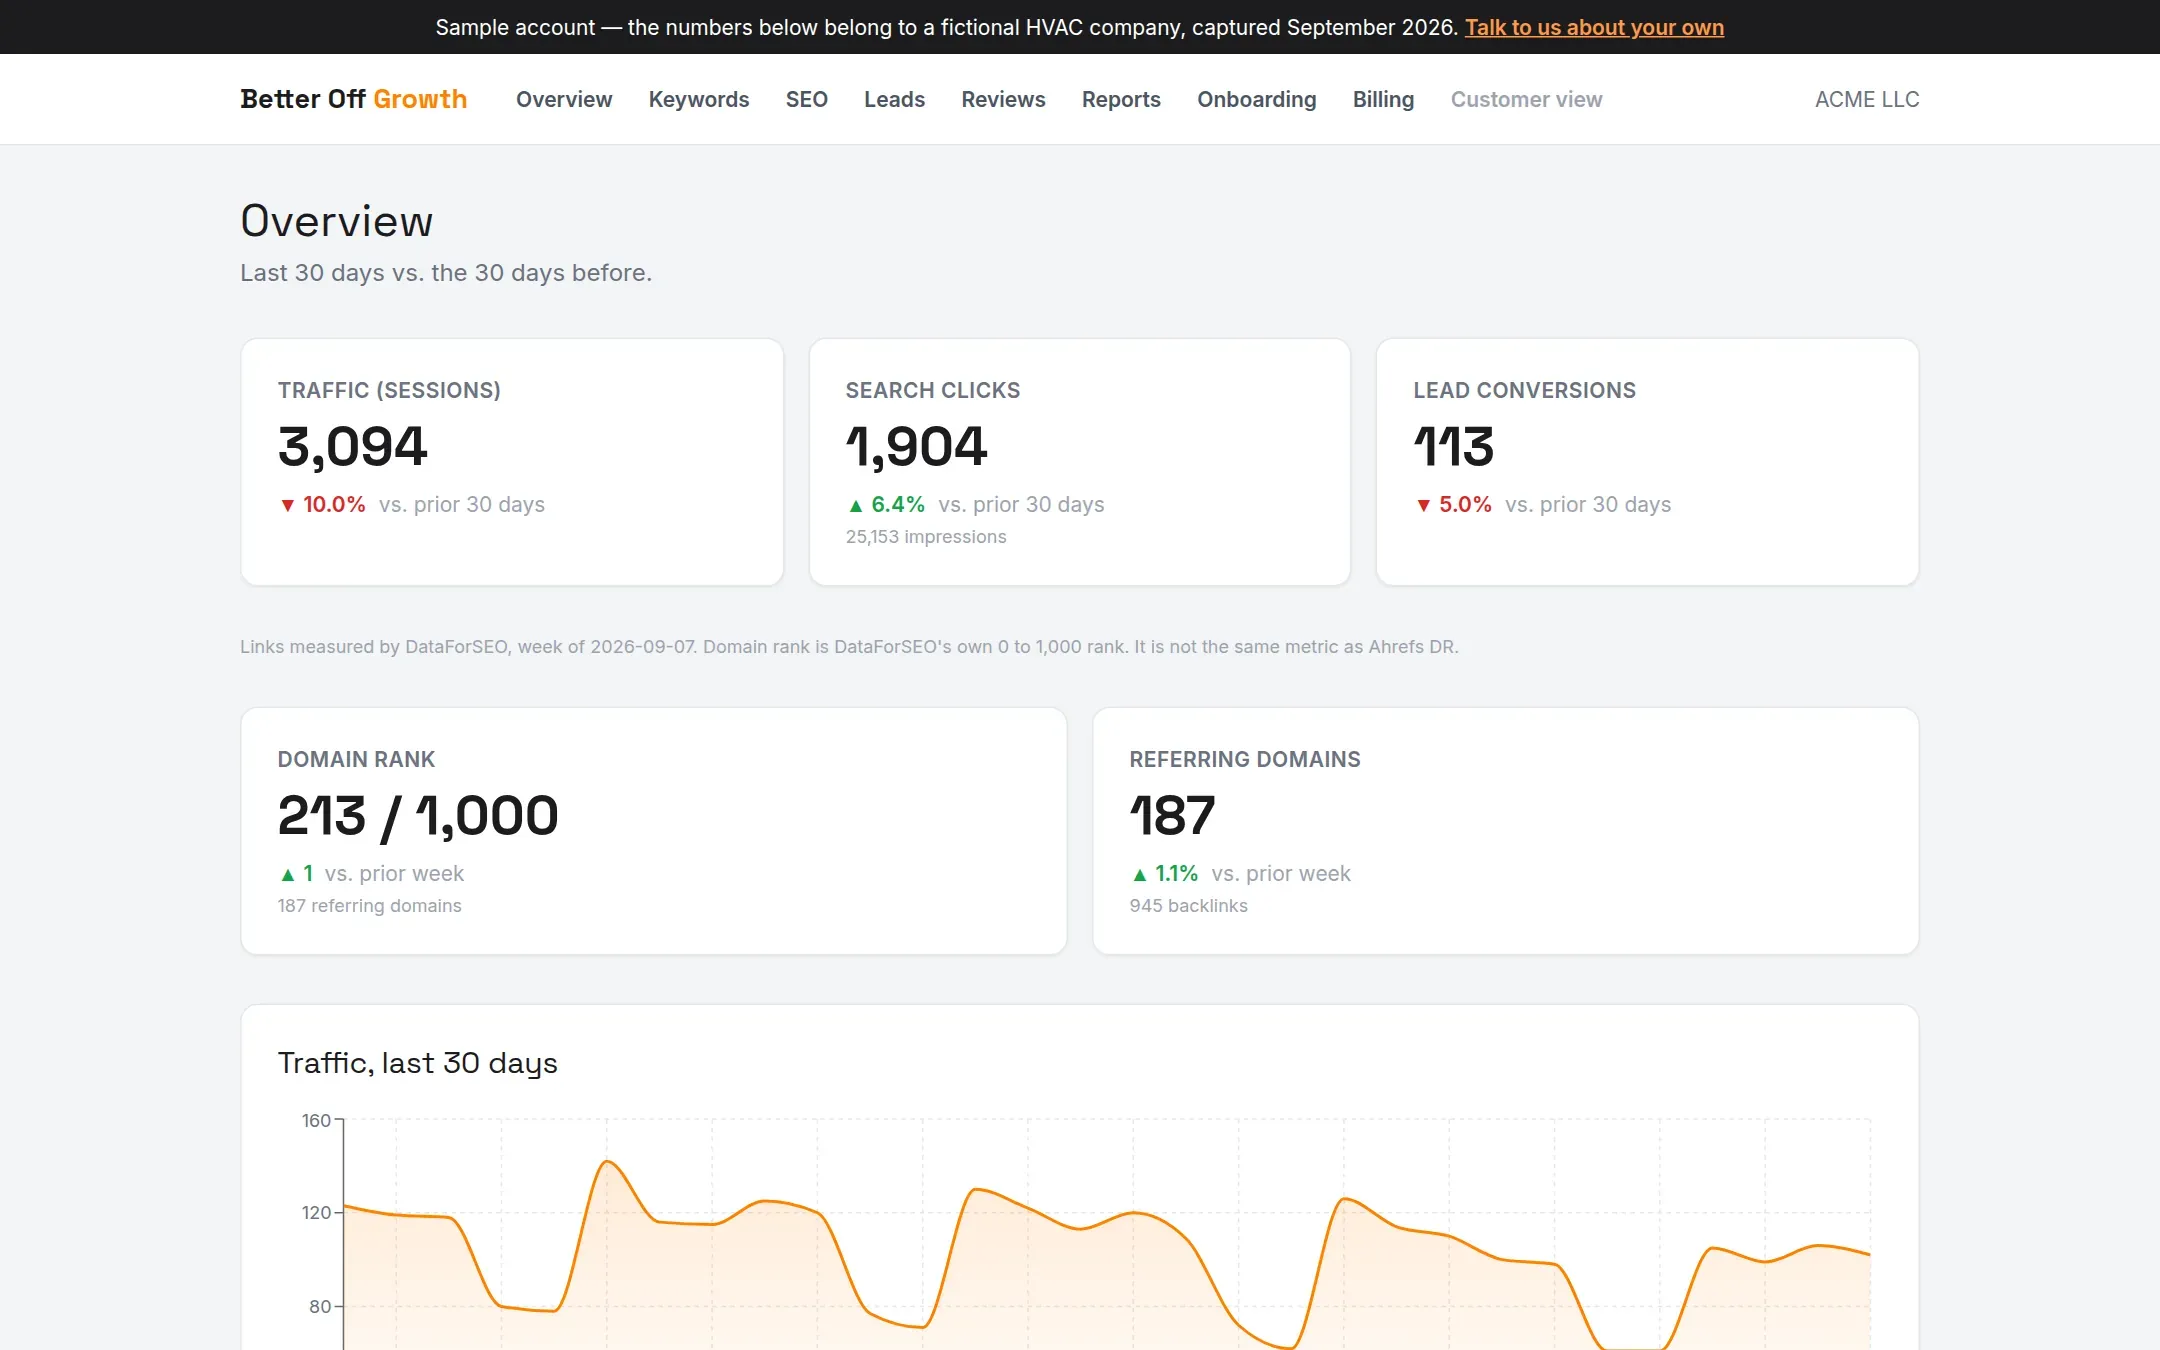
Visits, clicks from Google and leads for the last 30 days against the 30 before, plus the other sites linking to yours. The data comes from your own Google Analytics and Search Console, refreshed every night.
Every report I send you is stored there too, and new clients fill in their onboarding questions in the same place.
Click around the sample account
The sample dashboard is the real product with made-up numbers for a fictional HVAC company. Nothing to sign up for.
Open the sample dashboard